

Table of Contents
Introduction
The crypto market update 12 Sept 2025 shows renewed bullish momentum. Both Bitcoin (BTC) and Ethereum (ETH) have bounced back from strong support zones and are moving upward with positive signals. In this article, we provide a detailed BTC & ETH Price Analysis 12 Sept 2025, covering technical indicators, support and resistance levels, ETF net flows, and possible next targets.

Bitcoin (BTC) Price Analysis – 12 September 2025
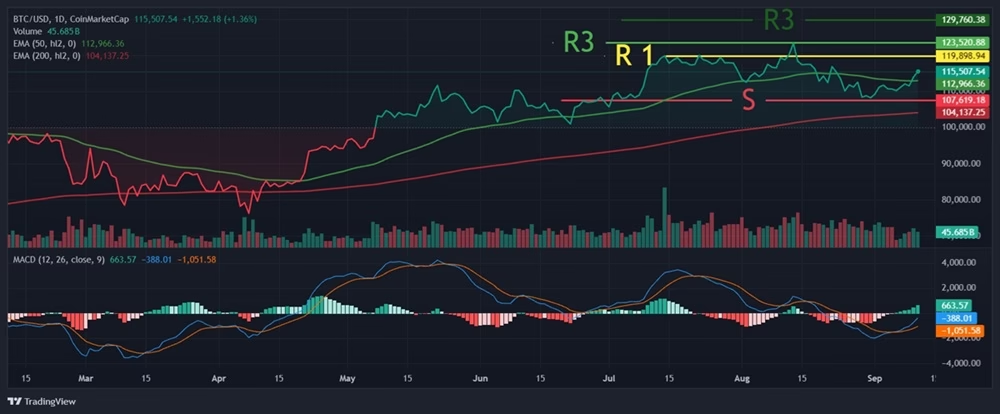
Current Price: $115,507 (+1.36%)
24h Volume: $45.68B
Technical Overview
- 50 EMA (Green): $112,966 → Price is trading above this, confirming a short-term bullish trend.
- 200 EMA (Red): $104,137 → BTC is also above long-term support, confirming a strong bullish zone.
Support Levels
- $112,000 – Immediate support
- $107,600 – Strong support zone
Resistance Levels
- $119,998 – First resistance
- $123,520 – Major resistance
- $129,760 – Long-term target
Indicators
- MACD: Positive crossover indicates strong bullish momentum.
- Volume: Buyer pressure is increasing, supporting the upward move.
BTC Conclusion:
Based on the BTC & ETH Price Analysis 12 Sept 2025, if Bitcoin closes above $120K on the daily chart, the next targets could be $123K and $129K. On the downside, $112K – $107K remain strong support zones.
Ethereum (ETH) Price Analysis – 12 September 2025
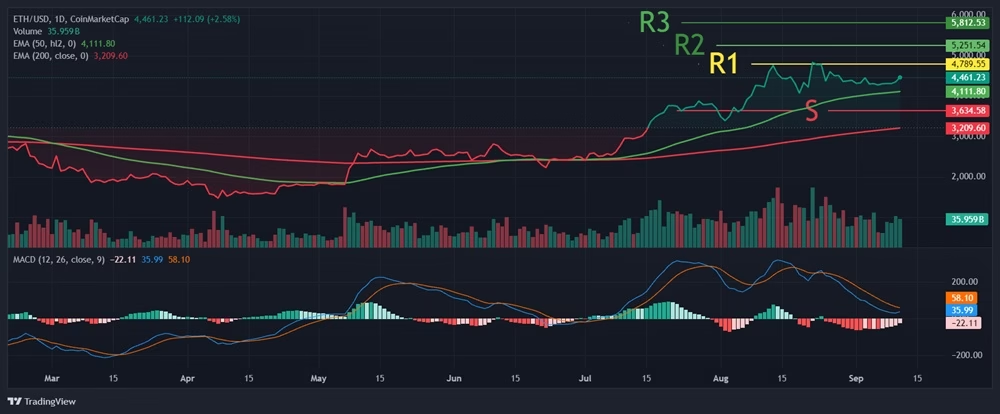
Current Price: $4,461 (+2.58%)
24h Volume: $35.95B
Technical Overview
- 50 EMA (Green): $4,111 → ETH is trading above this level, confirming short-term bullishness.
- 200 EMA (Red): $3,209 → ETH is far above this, showing strong long-term bullish momentum.
Support Levels
- $4,111 – First support
- $3,634 – Major support
Resistance Levels
- $4,789 – Immediate resistance
- $5,251 – Next major resistance
- $5,812 – Long-term target
Indicators
- MACD: Positive crossover with slight bullish strength.
- Volume: Increasing volume supports buyer activity and upward trend.
ETH Conclusion:
As per BTC & ETH Price Analysis 12 Sept 2025, if Ethereum breaks above $4,800, the short-term target will be $5,250 and the mid-term target $5,800. On the downside, $4,100 and $3,600 act as strong support zones.
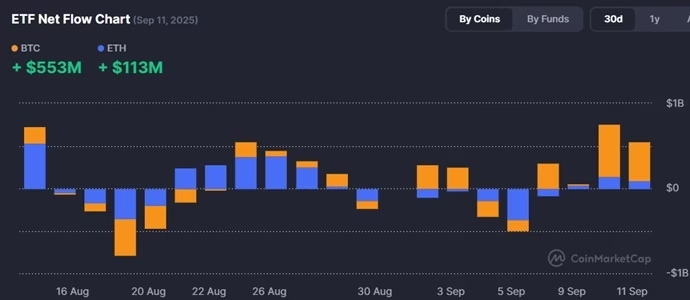
ETF Net Flow Update – 11 September 2025
- Bitcoin ETFs: Net inflow of +$552.70M was recorded, reflecting strong investor confidence in BTC.
- Ethereum ETFs: Net inflow of +$113.10M indicates increasing demand and positive sentiment for ETH.
This ETF inflow data strengthens the bullish momentum observed in the crypto market update 12 Sept 2025, showing that institutional investors are actively supporting both BTC and ETH.
Overall Market View
Based on the BTC & ETH Price Analysis 12 Sept 2025:
- Bitcoin (BTC): Sustaining above $120K could lead to a test of a new all-time high.
- Ethereum (ETH): A breakout above $4,800 can open the way for a move toward $5,800.
The crypto market update 12 Sept 2025 shows a bullish structure. In the coming days, FOMC policy decisions and global financial updates will play a key role in deciding the next market direction.
FAQs – BTC & ETH Price Analysis 12 Sept 2025
Q1: What is the current support level for Bitcoin (BTC)?
The immediate support is $112,000 and strong support is at $107,600.
Q2: What could be the next target for Bitcoin (BTC)?
If BTC closes above $120K, the next targets are $123K and $129K.
Q3: What is the first resistance level for Ethereum (ETH)?
Ethereum’s first resistance is at $4,789.
Q4: What is the long-term target for Ethereum (ETH)?
If ETH breaks above $4,800, the mid-term target is $5,250 and the long-term target is $5,800.
Q5: What were the ETF net flows on 11 September 2025?
Bitcoin ETFs saw inflows of +$552.70M, while Ethereum ETFs recorded +$113.10M inflows.
Q6: Is the crypto market bullish or bearish right now?
Currently, both Bitcoin and Ethereum are in a bullish structure with strong buyer and institutional support, as confirmed by the crypto market update 12 Sept 2025.
Also Read Solana Crypto 2025: Complete SOL Review & Coin Features